OK.Wahl
Internetpräsentation
Version 2.2.7
Vorläufiges Ergebnis zur Landtagswahl 2013 am 15.09.2013
Landkreis Erlangen-Höchstadt - Gemeinde Bubenreuth
Es wurden alle Stimmbezirke ausgewertet.
Wahlbeteiligung, Stimmzettel, Stimmen
| Wahlbeteiligung: | 74,01% |
|---|---|
| Stimmberechtigte: | 3.467 |
| Wähler: | 2.566 |
| Ungültige Erststimmen: | 27 |
| Gültige Erststimmen: | 2.539 |
| Ungültige Zweitstimmen: | 29 |
| Gültige Zweitstimmen: | 2.537 |
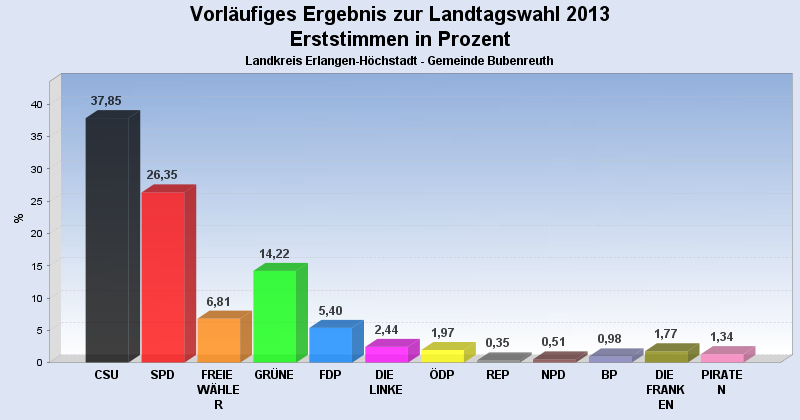
Erststimmen nach Wahlvorschlag
| Partei | Erststimmen | Prozent | |
|---|---|---|---|
| 1 | Nussel, Walter ( CSU ) | 961 | 37,85% |
| 2 | Hiersemann, Alexandra ( SPD ) | 669 | 26,35% |
| 3 | Prell, Patrick ( FREIE WÄHLER ) | 173 | 6,81% |
| 4 | Wening, Helmut ( GRÜNE ) | 361 | 14,22% |
| 5 | Rohde, Jörg ( FDP ) | 137 | 5,40% |
| 6 | Reimann, Cornelia ( DIE LINKE ) | 62 | 2,44% |
| 7 | Reinhart, Manfred ( ÖDP ) | 50 | 1,97% |
| 8 | Staszewski, Susanne ( REP ) | 9 | 0,35% |
| 9 | Rorich, Christine ( NPD ) | 13 | 0,51% |
| 10 | Kral, Manfred ( BP ) | 25 | 0,98% |
| 11 | Schröder, Jürgen ( DIE FRANKEN ) | 45 | 1,77% |
| 12 | Herrmann, Markus ( PIRATEN ) | 34 | 1,34% |
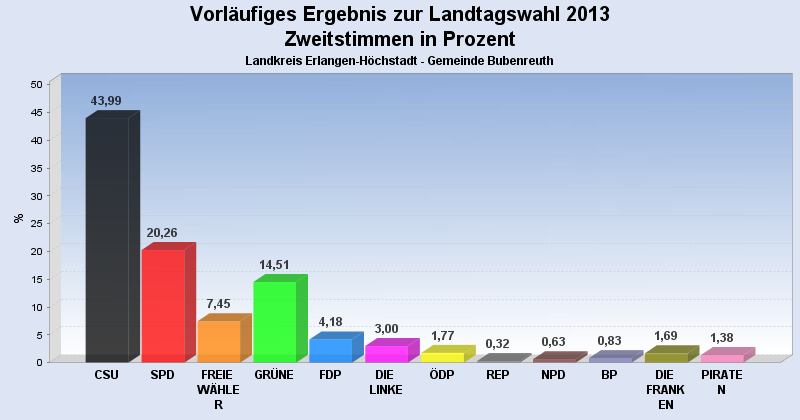
Zweitstimmen nach Wahlvorschlag
| Partei | Zweitstimmen | Prozent | |
|---|---|---|---|
| 1 | CSU | 1.116 | 43,99% |
| 2 | SPD | 514 | 20,26% |
| 3 | FREIE WÄHLER | 189 | 7,45% |
| 4 | GRÜNE | 368 | 14,51% |
| 5 | FDP | 106 | 4,18% |
| 6 | DIE LINKE | 76 | 3,00% |
| 7 | ÖDP | 45 | 1,77% |
| 8 | REP | 8 | 0,32% |
| 9 | NPD | 16 | 0,63% |
| 10 | BP | 21 | 0,83% |
| 11 | DIE FRANKEN | 43 | 1,69% |
| 12 | PIRATEN | 35 | 1,38% |
- Stand: 27.09.2013 09:43:36
 Diagramm
 Seitenanfang